ERD
Here’s a quick way to build entity relationship diagrams using a simple markup language called nomnoml.
Check-out the website at NomNoml
And here’s an example which is easily embedded into a website such as Confluence:
<!DOCTYPE html>
 <html lang="en">
 <head>
 <meta charset="utf-8">
 <script src="https://cdnjs.cloudflare.com/ajax/libs/lodash.js/3.9.3/lodash.min.js"></script>
 <script src="https://cdnjs.cloudflare.com/ajax/libs/dagre/0.8.2/dagre.min.js"></script>
 <script src="https://cdnjs.cloudflare.com/ajax/libs/nomnoml/0.0.3/nomnoml.min.js"></script>
 </head>
 <body>
 <canvas id="target-canvas"></canvas>
 <script>
  var canvas = document.getElementById('target-canvas');
  var source = `
 #zoom: 0.8
 [Talend Cloud|orchestration];
 [AWS|CSV files];
 [Snowflake|SQL database];
 [O365|reports];
 [Remote Engine|on-premise bridge];
 [PowerBI];
 [O365] <- [PowerBI];
 [Snowflake] <- [PowerBI];
 [Talend Cloud] <- [Remote Engine];
 [AWS] <- [Remote Engine];
 [Snowflake] <- [Remote Engine];
 [LOB1];
 [LOB2];
 [Remote Engine] -> [LOB1];
 [Remote Engine] -> [LOB2]
`;
 nomnoml.draw(canvas, source);
 </script>
 </body>
</html>
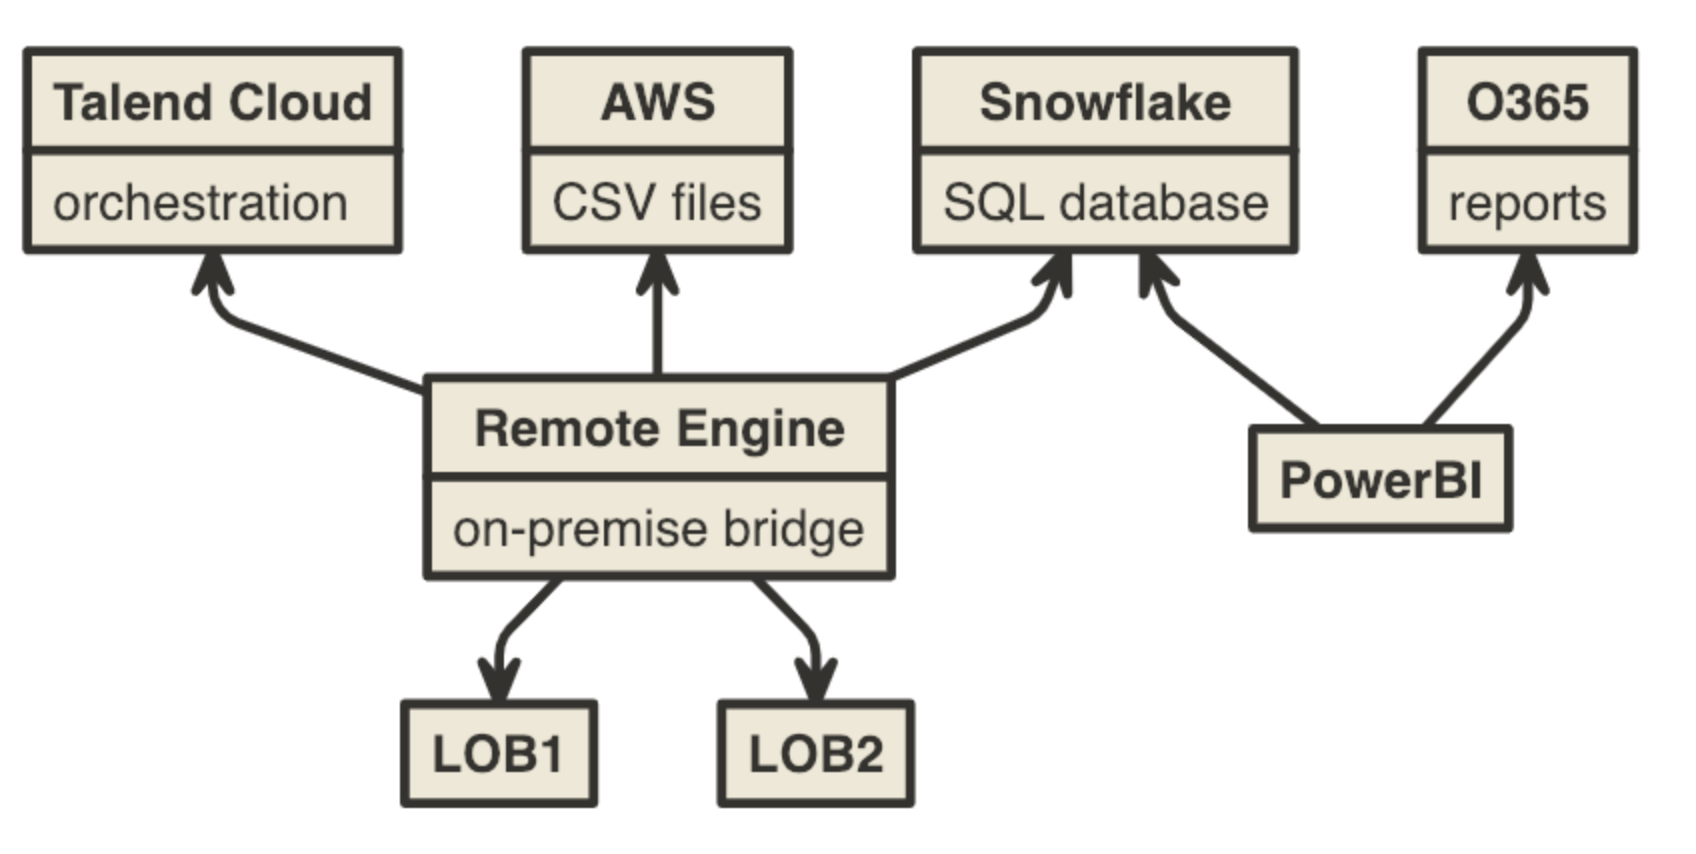
This is the output from the above markup:

Example NomNoml
I think this works best in Chrome - but who uses IE anyway ?! (update: seems to work in Safari too)